Automating test execution and analysis with speed, accuracy, and clarity.
Quantello Test Automation Framework is a web-based platform that streamlines test case execution, result analysis, and client management for QA teams.
The system allows QA engineers to:
This project aimed to build a centralized, easy-to-use test automation dashboard that reduces manual effort, minimizes errors, and empowers QA teams with actionable insights.

Quality Assurance (QA) teams often struggle with disconnected tools and manual processes for managing test cases. Key challenges included:
These gaps resulted in wasted time, inconsistent testing, and unreliable reporting, making it difficult for QA teams to scale effectively.
The Quantello Test Automation Framework was designed to:
Designing Quantello required creating a clear, structured workflow for QA engineers, while also addressing multi-client complexity and ensuring scalability. Below are the major UX decisions:
Why: QA engineers often work with different test formats; supporting both prevents blockers and ensures inclusivity.
Why: Reduced manual tagging effort and enforced standardization across all test runs.
Why: Agencies often serve multiple clients; keeping tests organized per client improves clarity and accountability.
Why: Running large test sets can take time; feedback loops and warnings prevent errors and wasted effort.
Why: QA engineers need both at-a-glance success rates and deep debugging data in one place.
Why: Historical visibility enables traceability, comparisons, and accountability in QA reporting.
Why: Helps QA engineers track personal contributions and provides transparency for managers.
The final design of Quantello focused on clarity, structure, and efficiency, ensuring QA engineers could move smoothly from uploading test cases to analyzing results. Here are the key flows and representative screens:
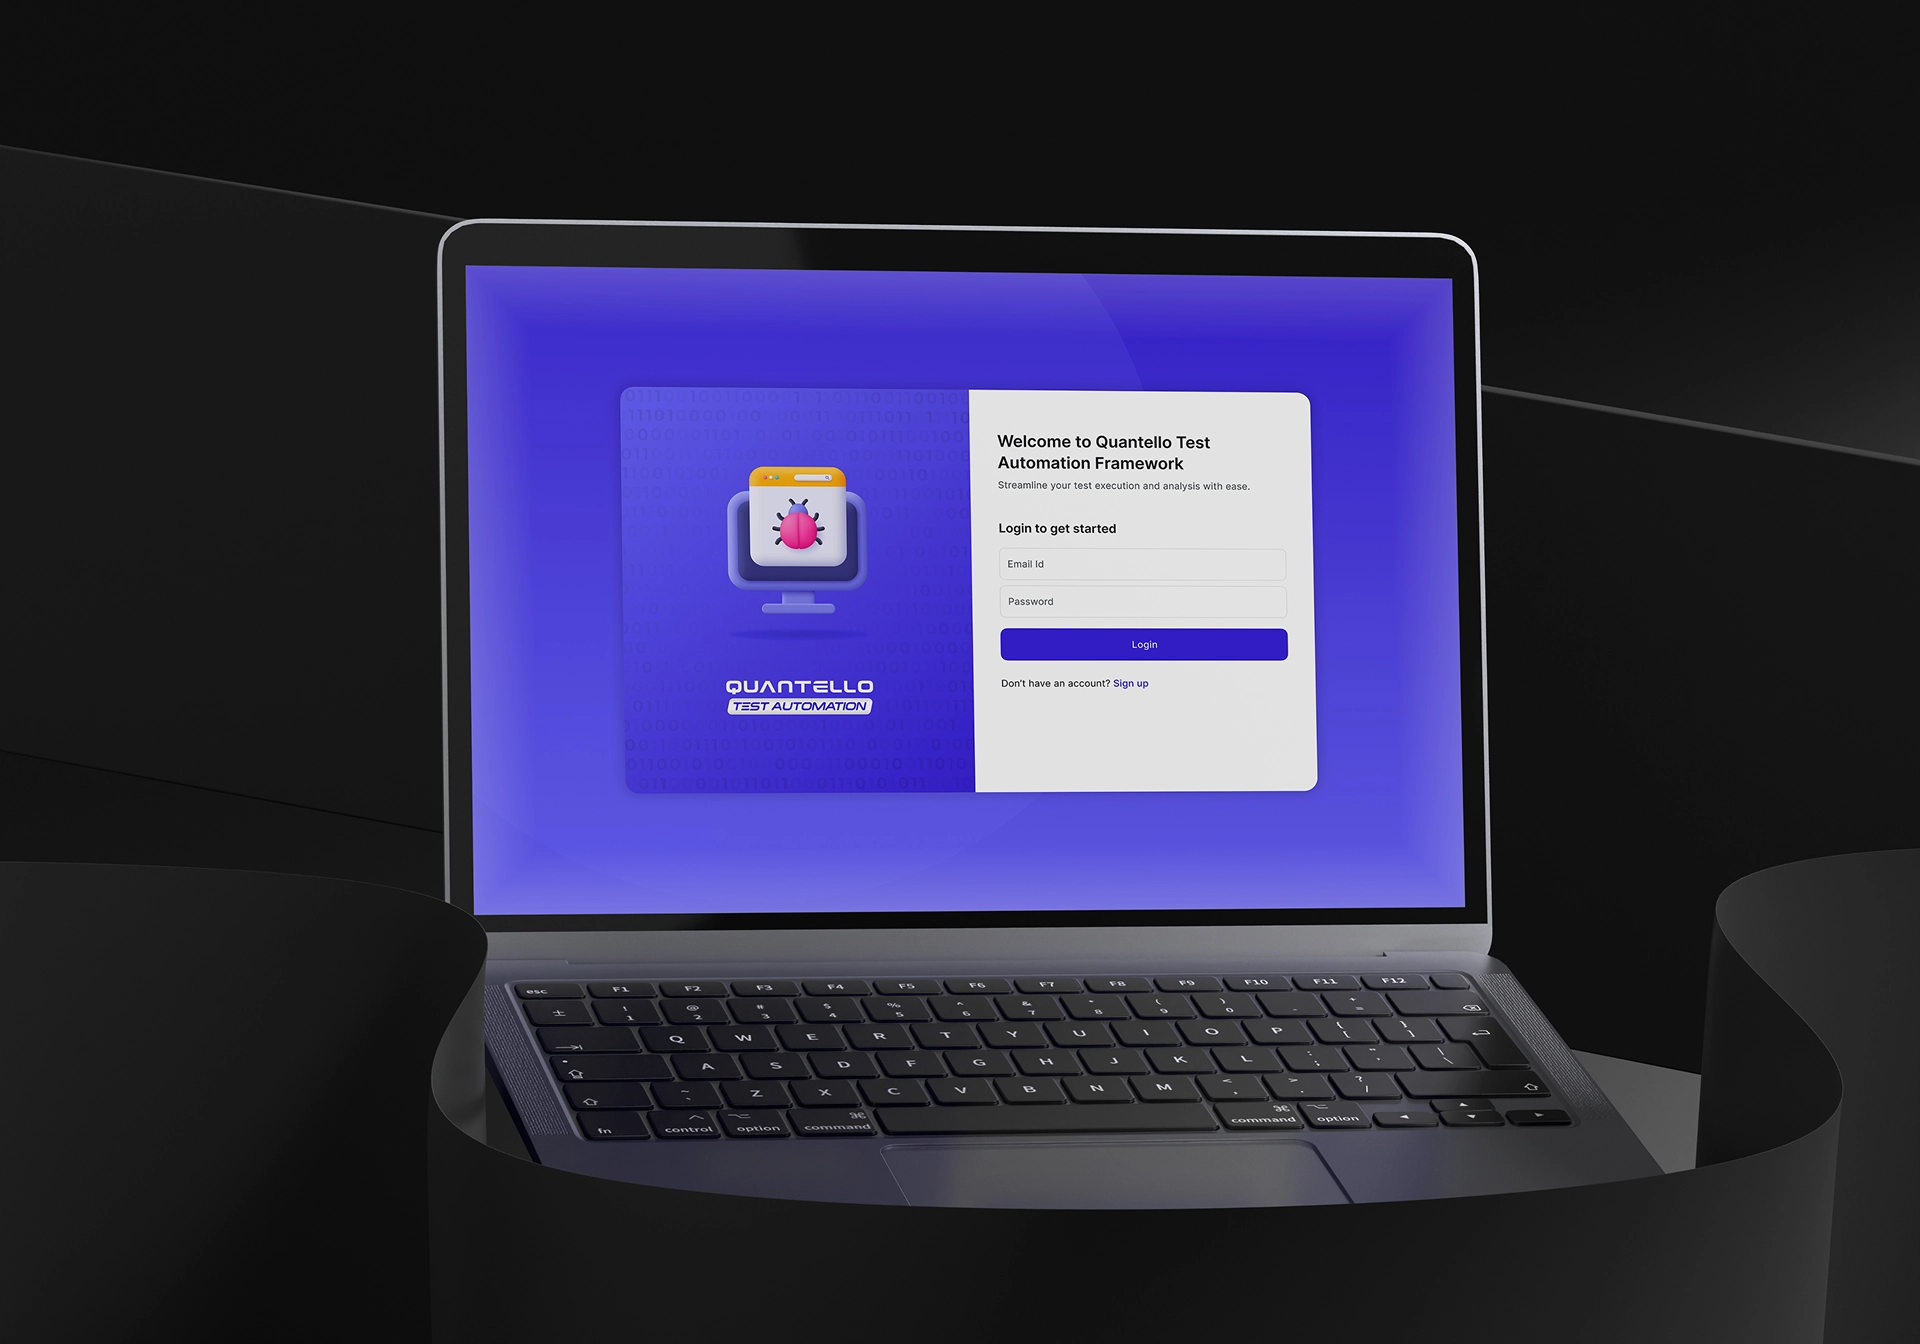
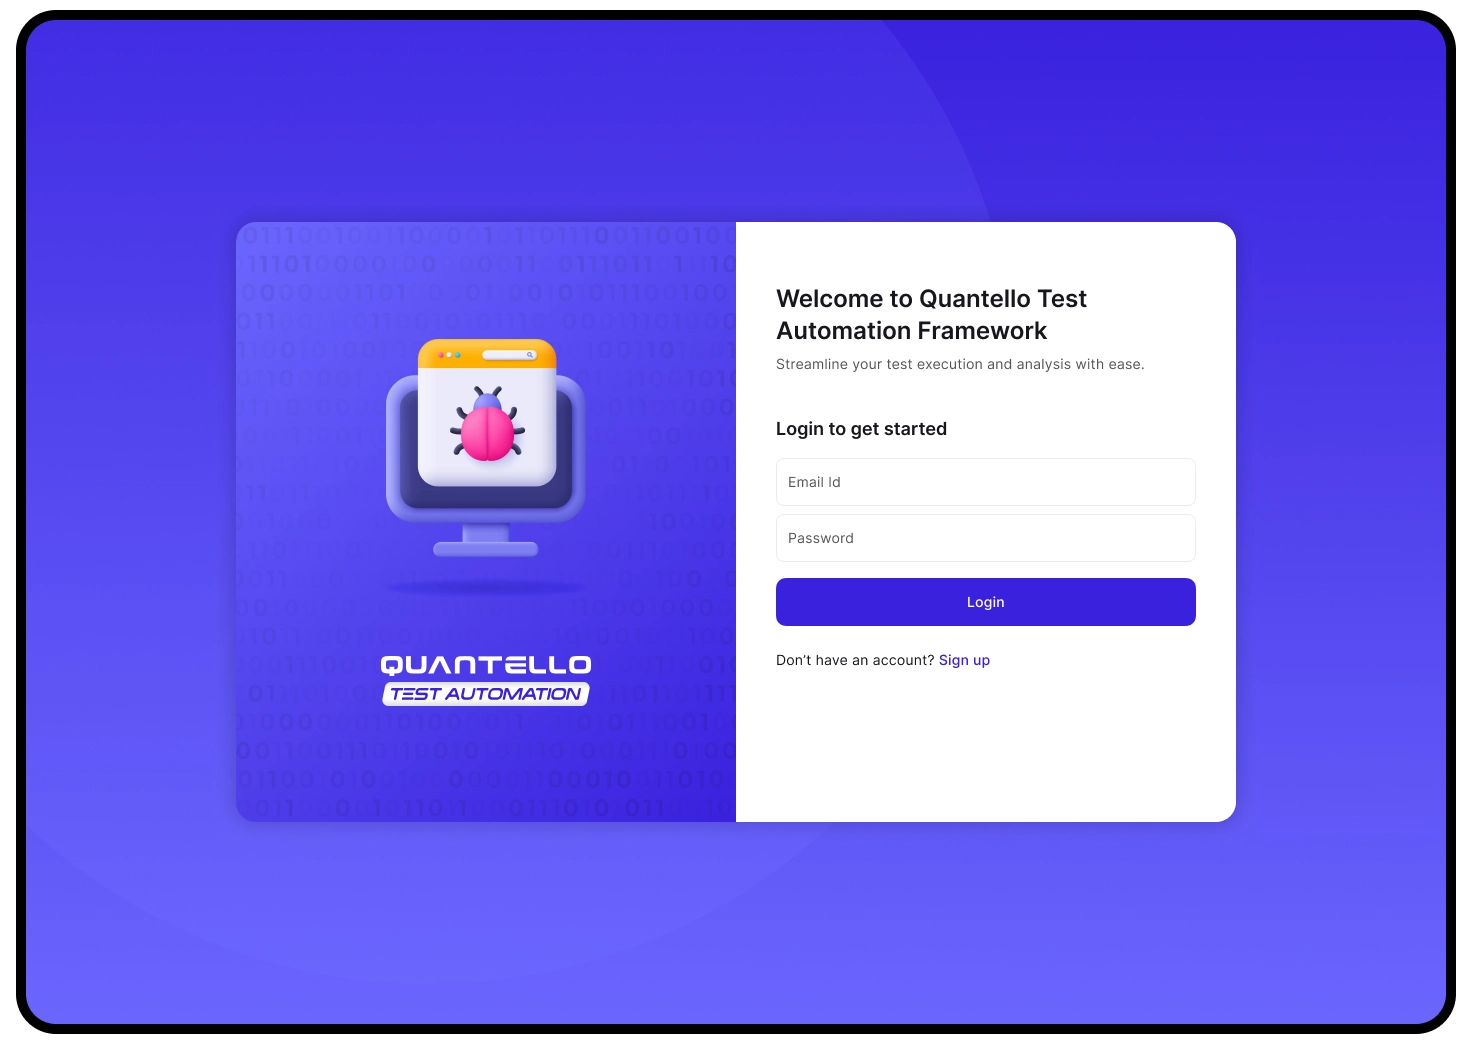
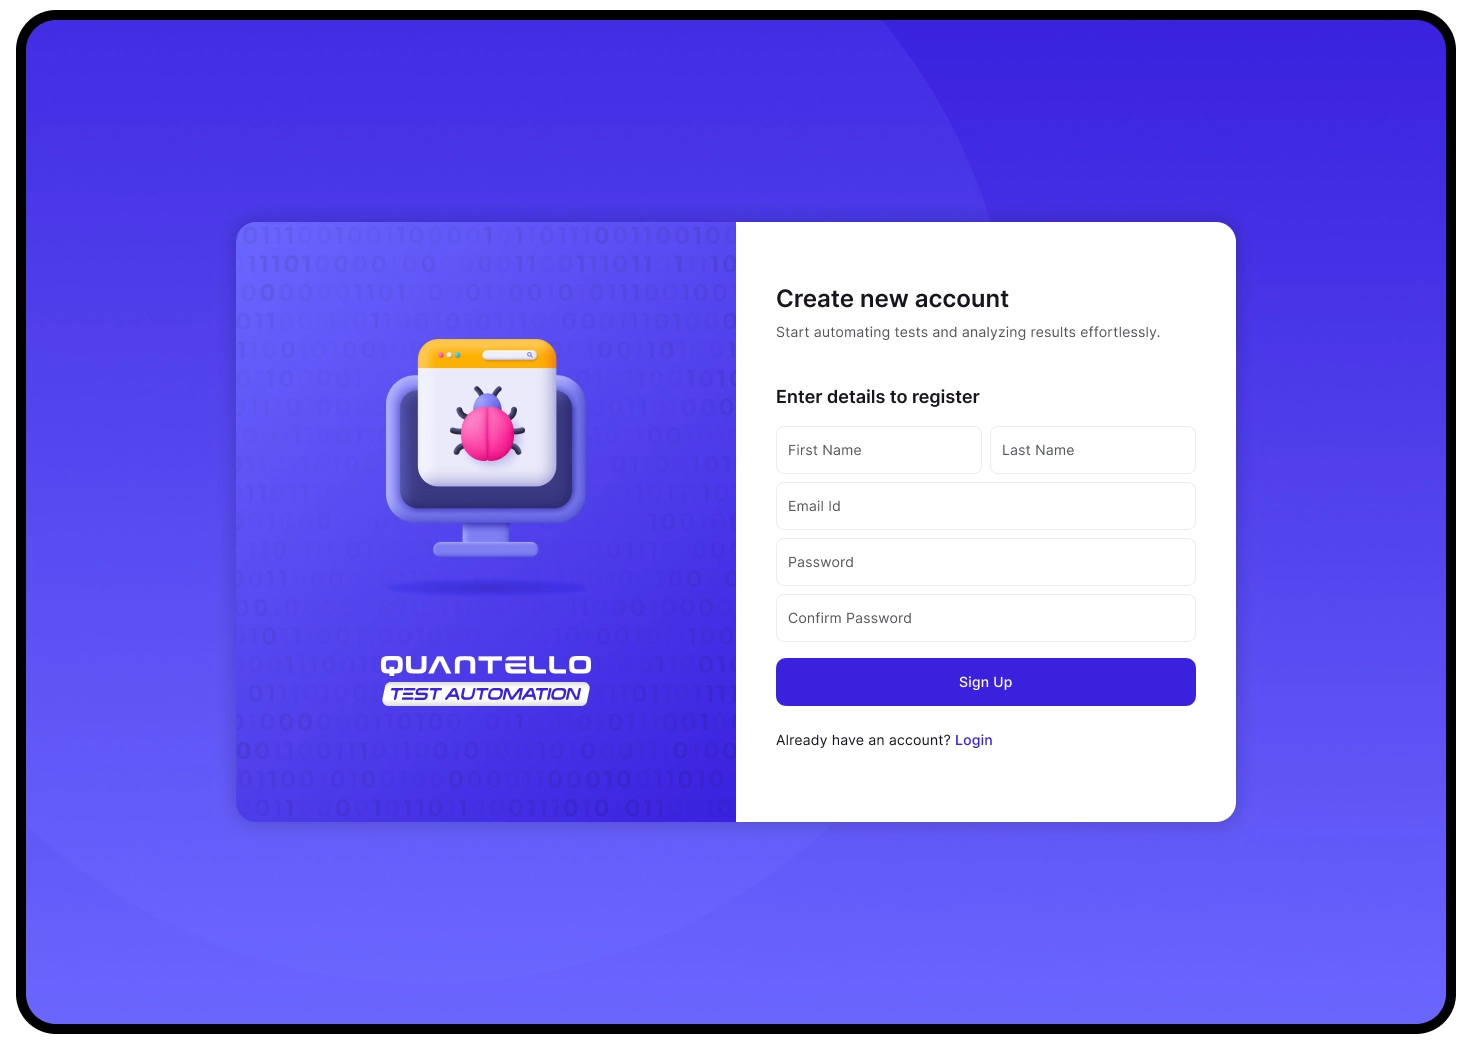
Simple, minimal authentication screens reduce barriers to entry. Clear CTAs guide users to sign in or register quickly.
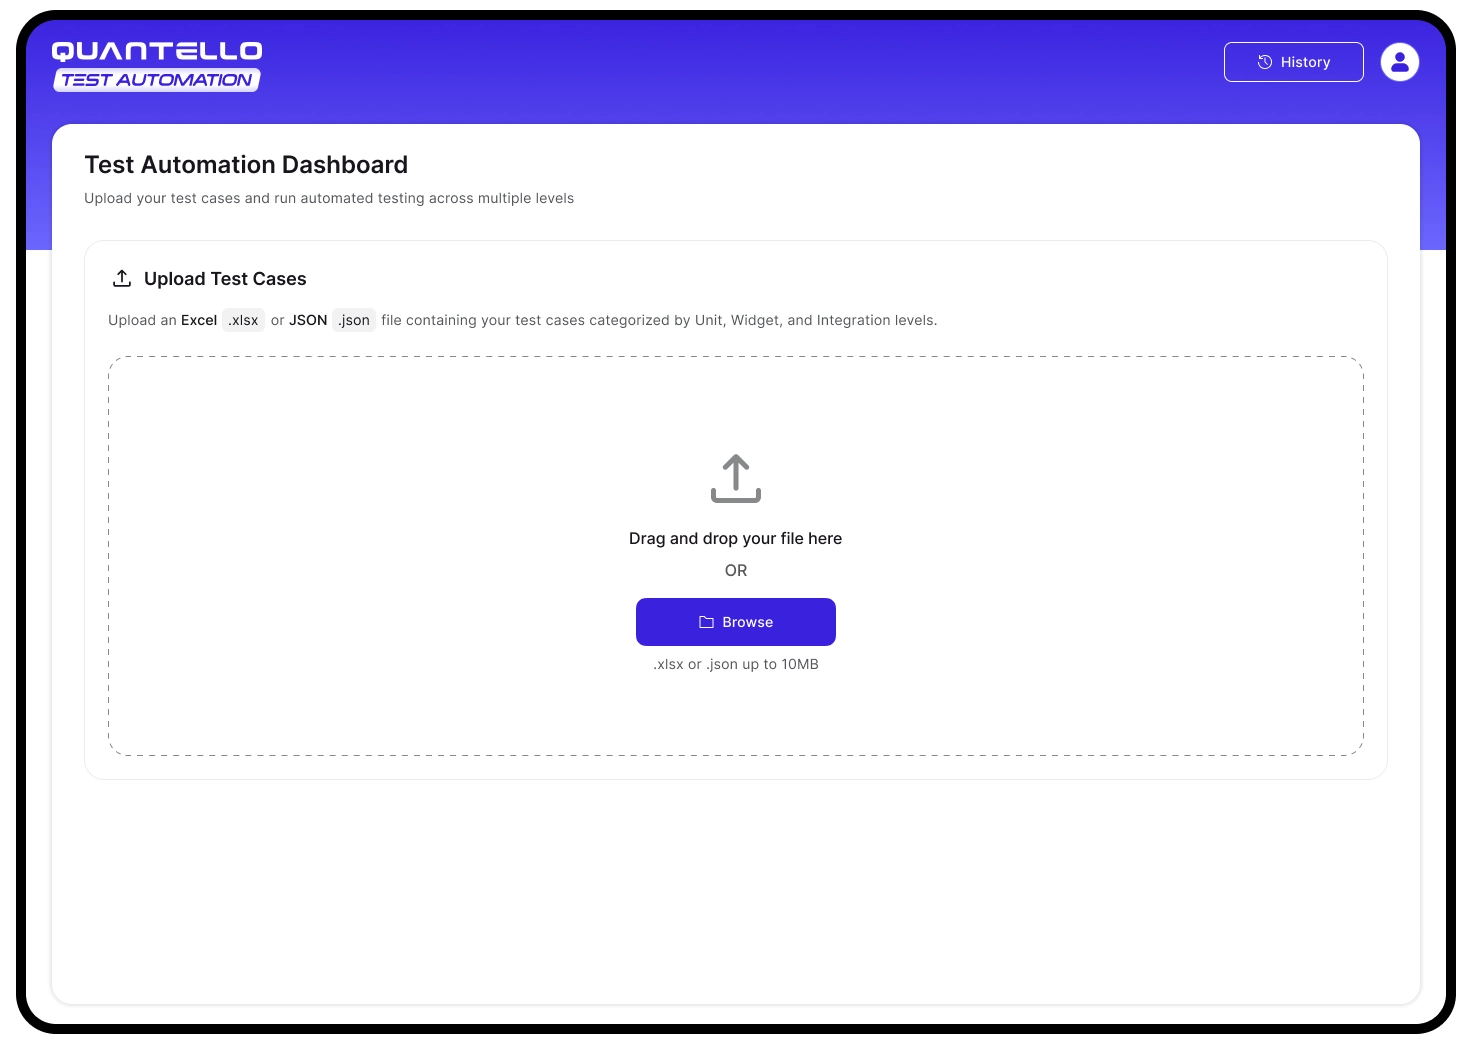
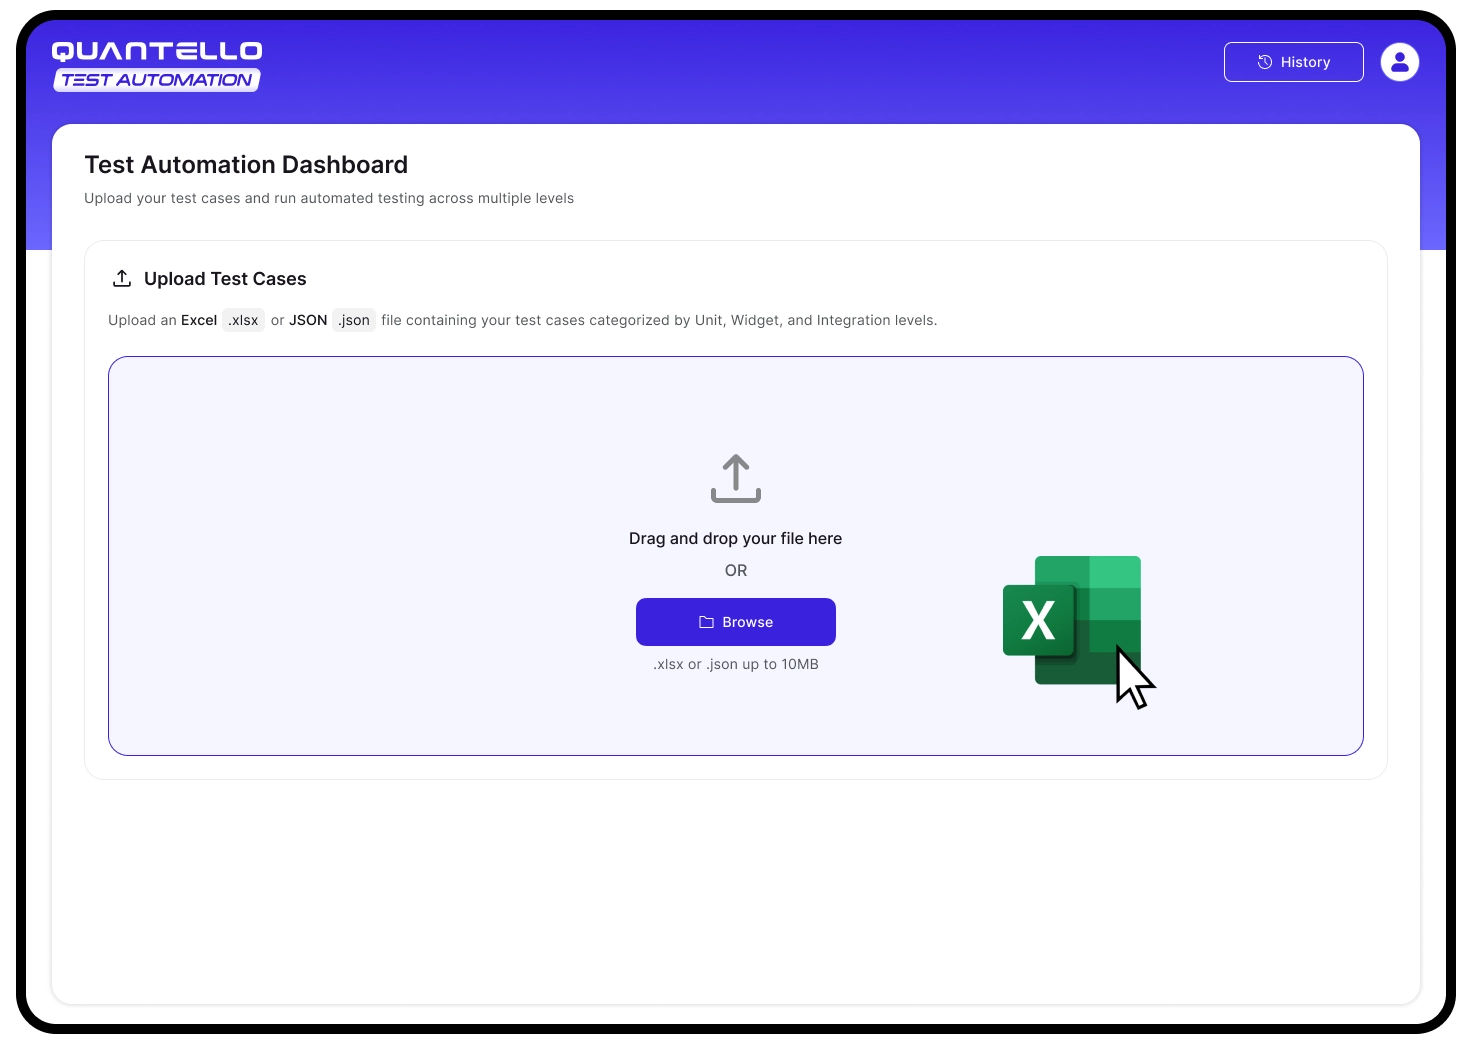
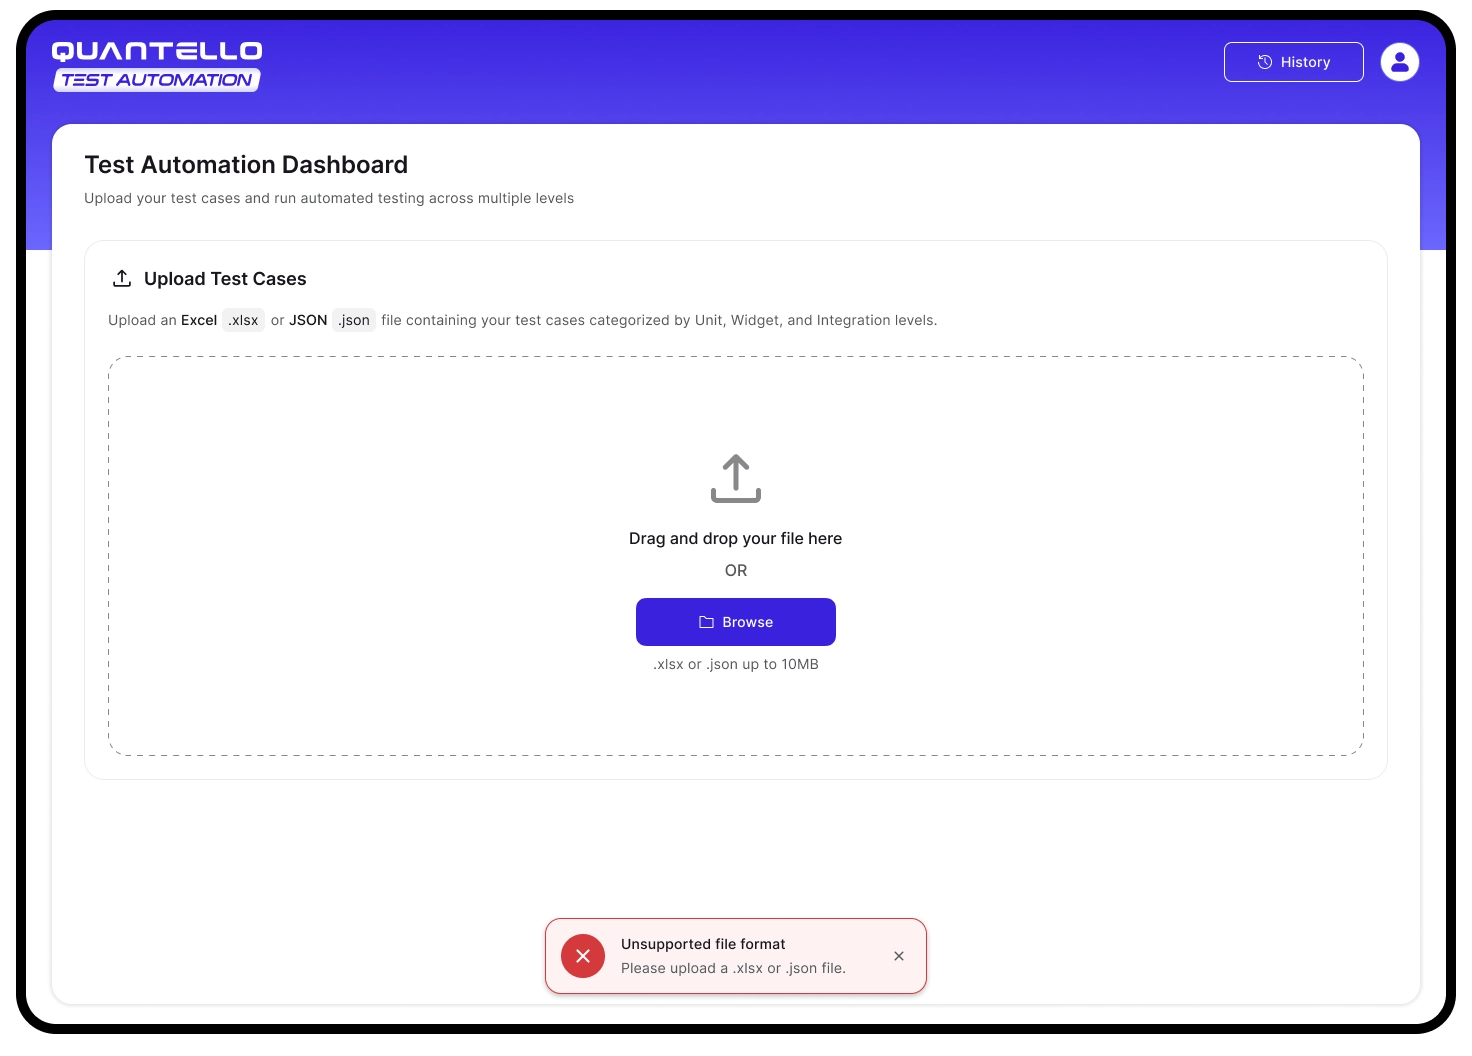
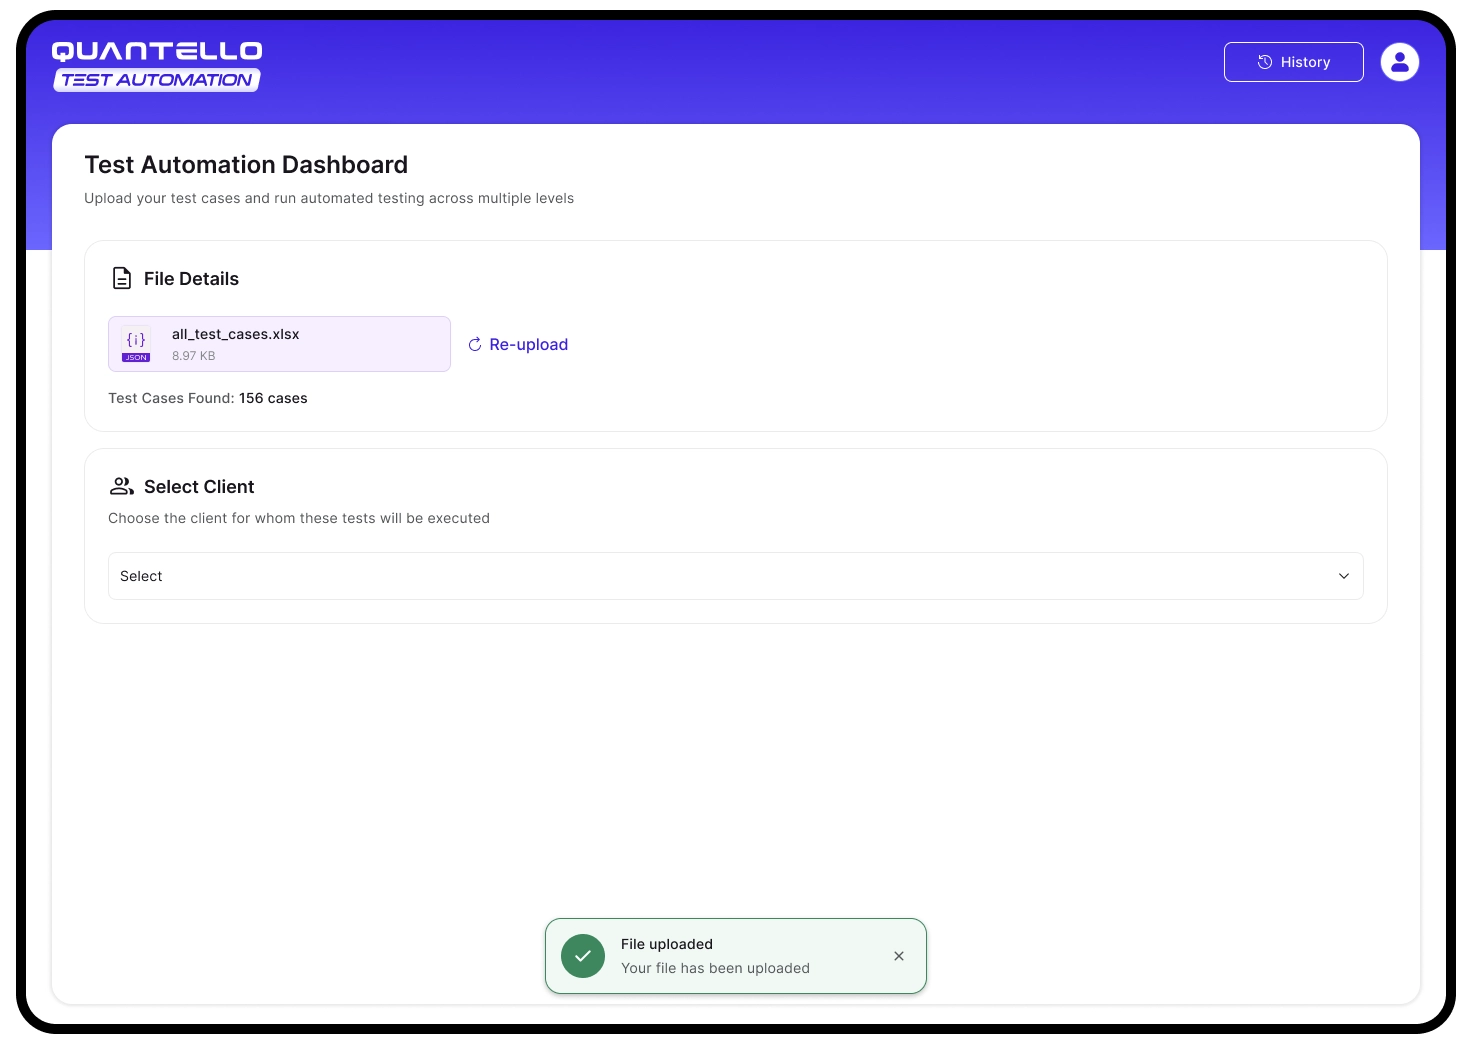
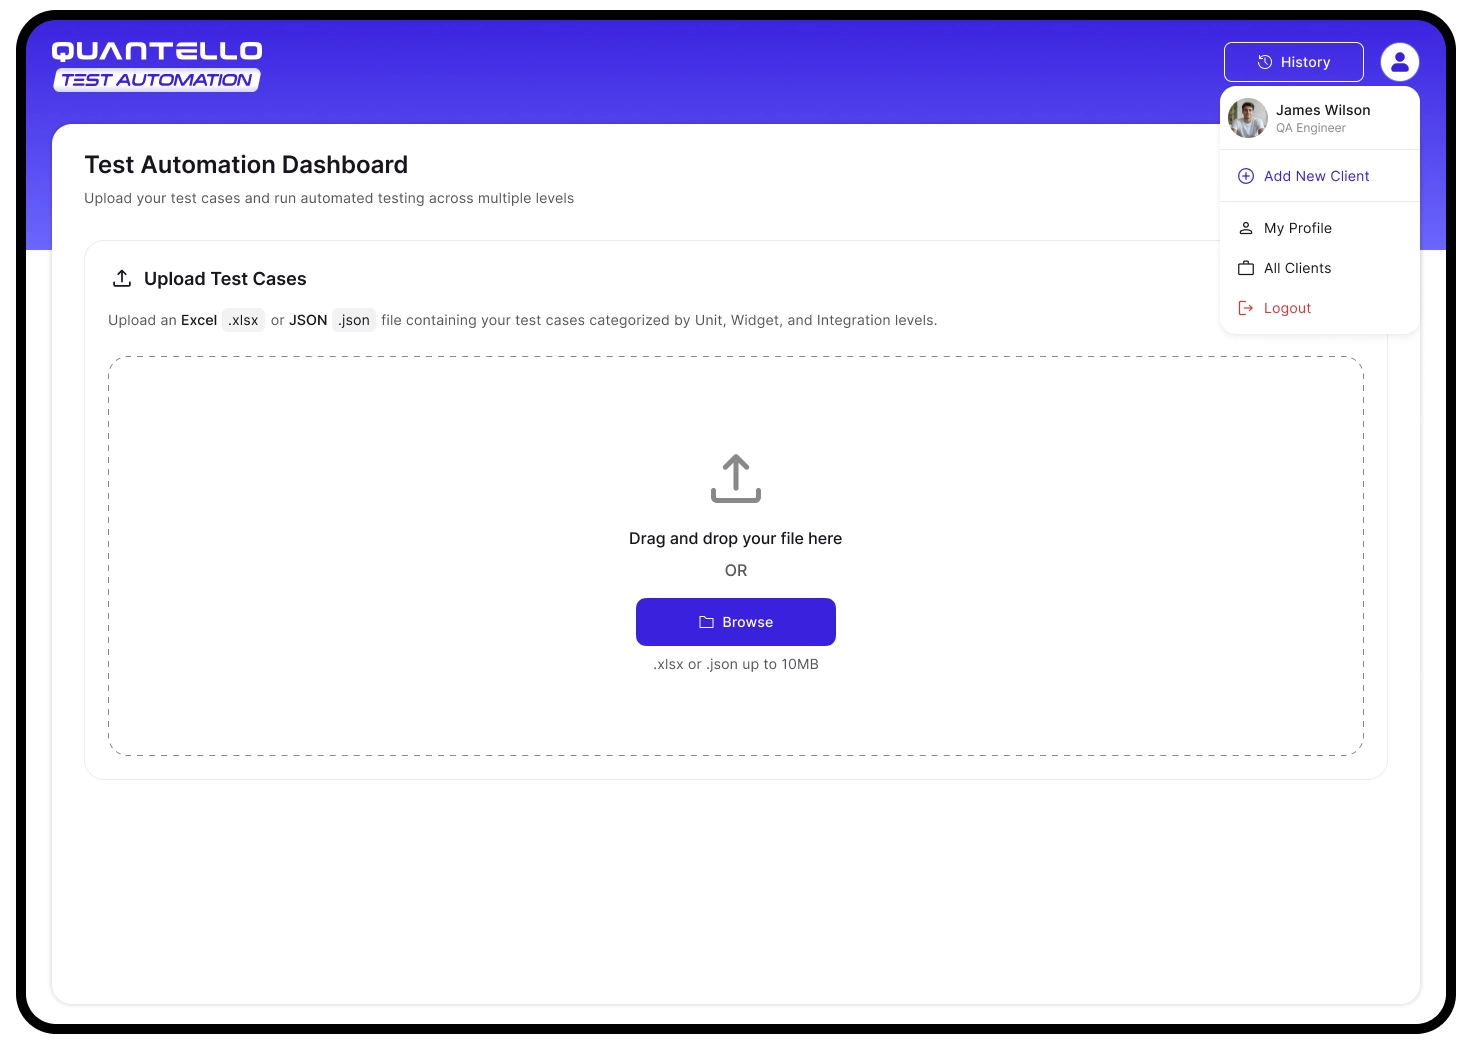
Drag-and-drop and browse options support diverse user workflows. Immediate feedback on file format/size avoids frustration.
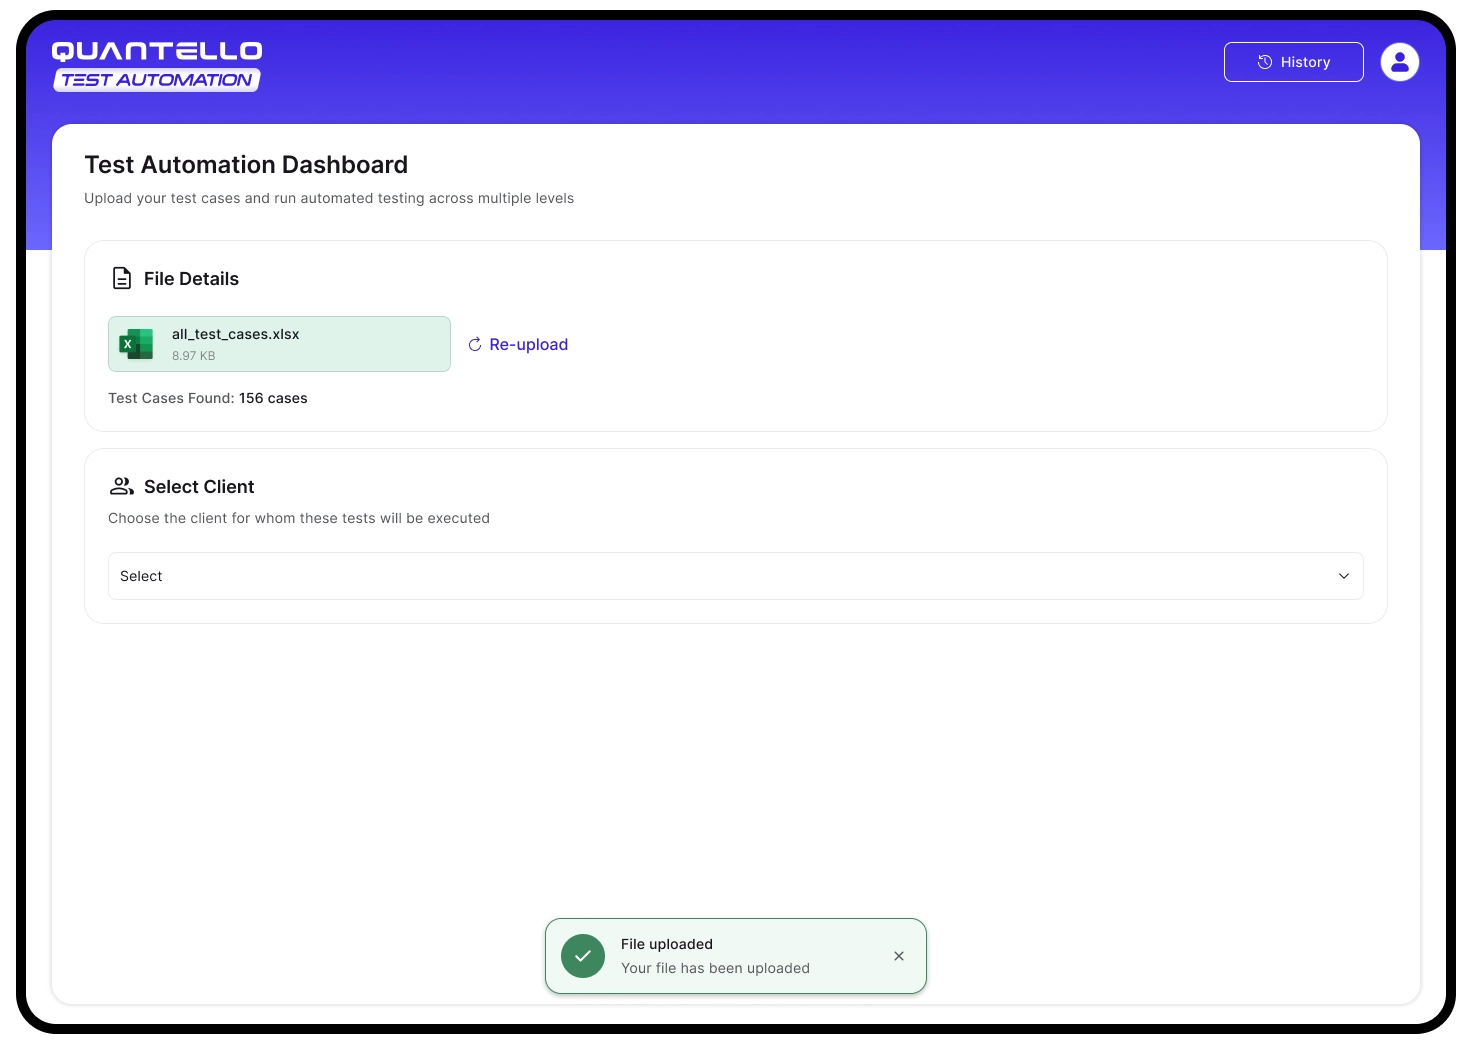
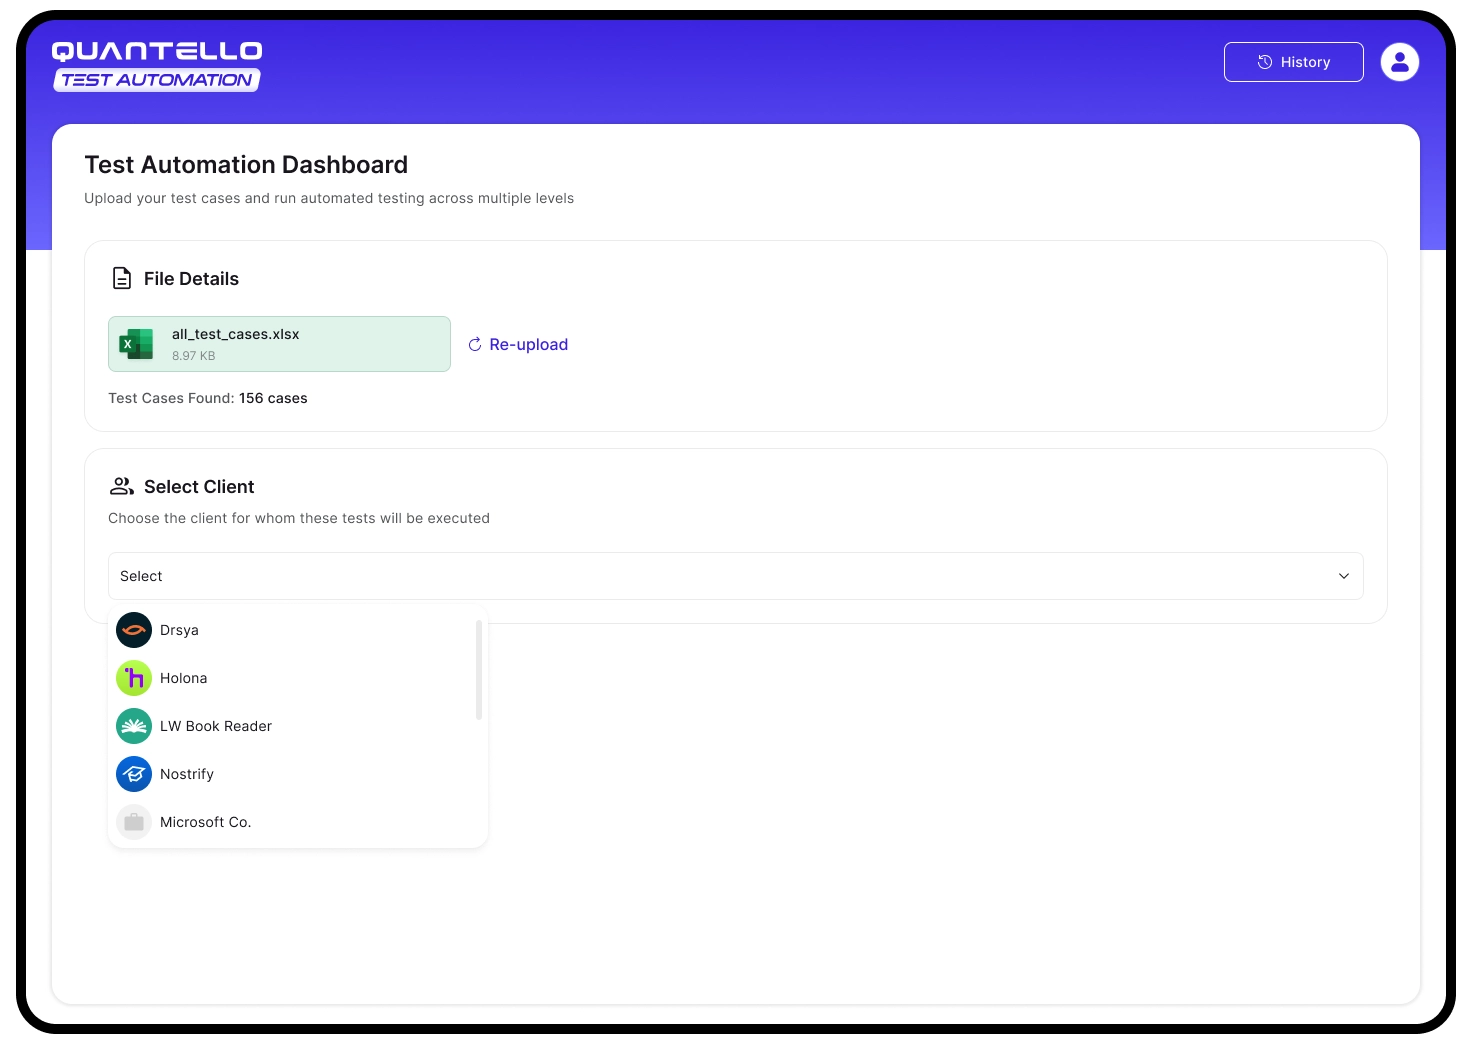
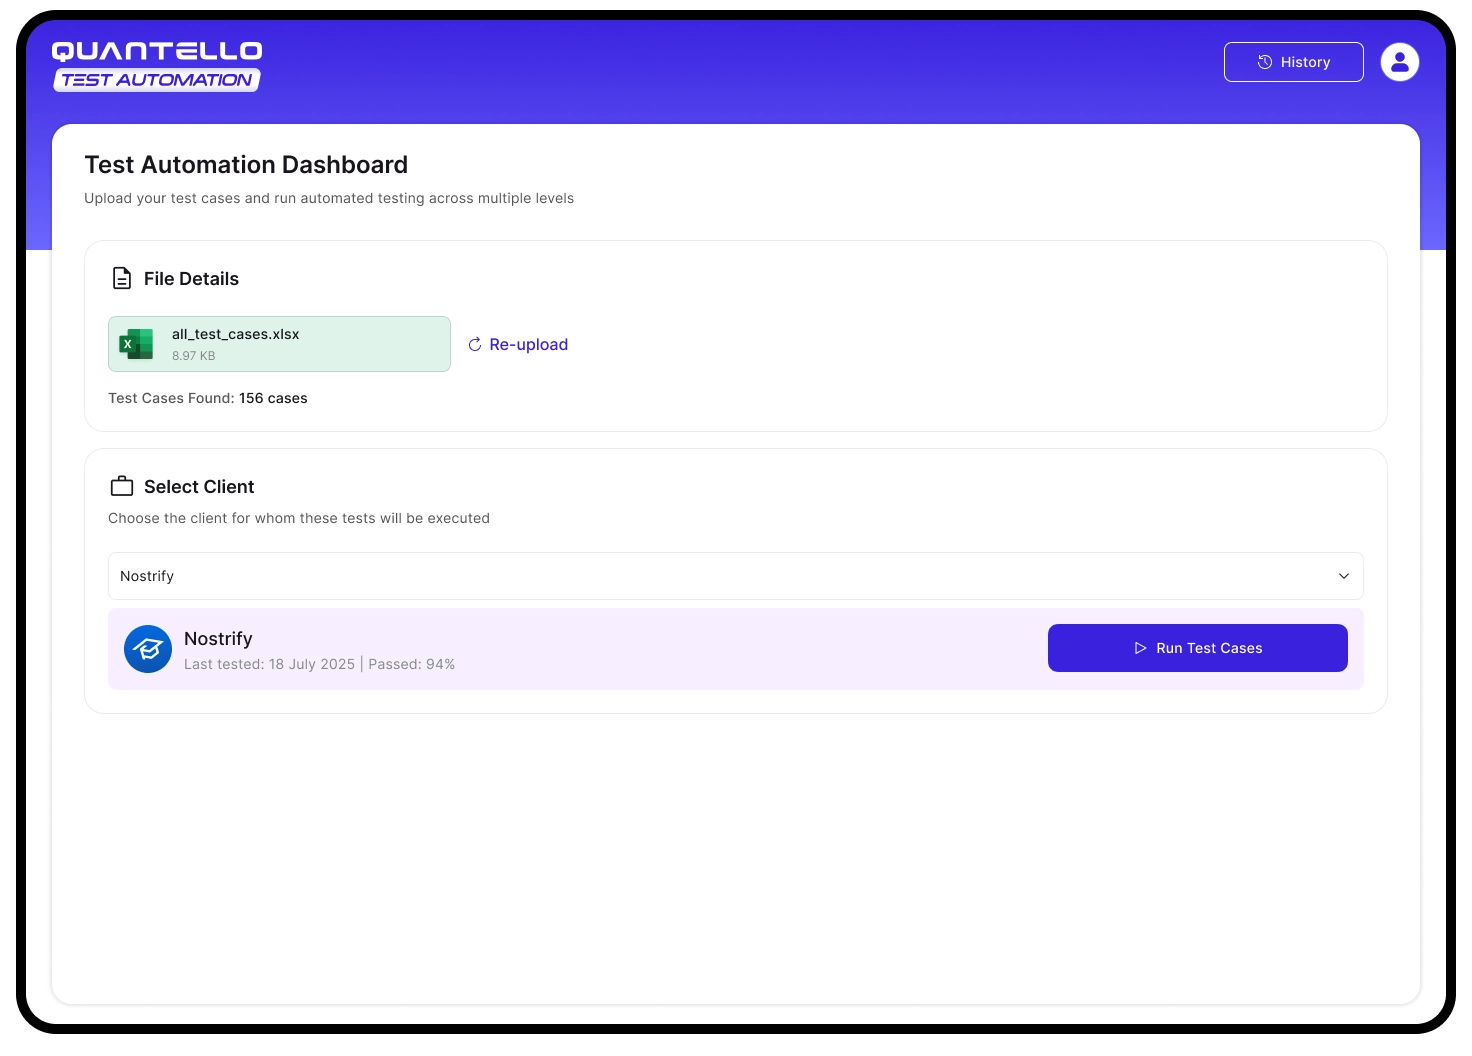
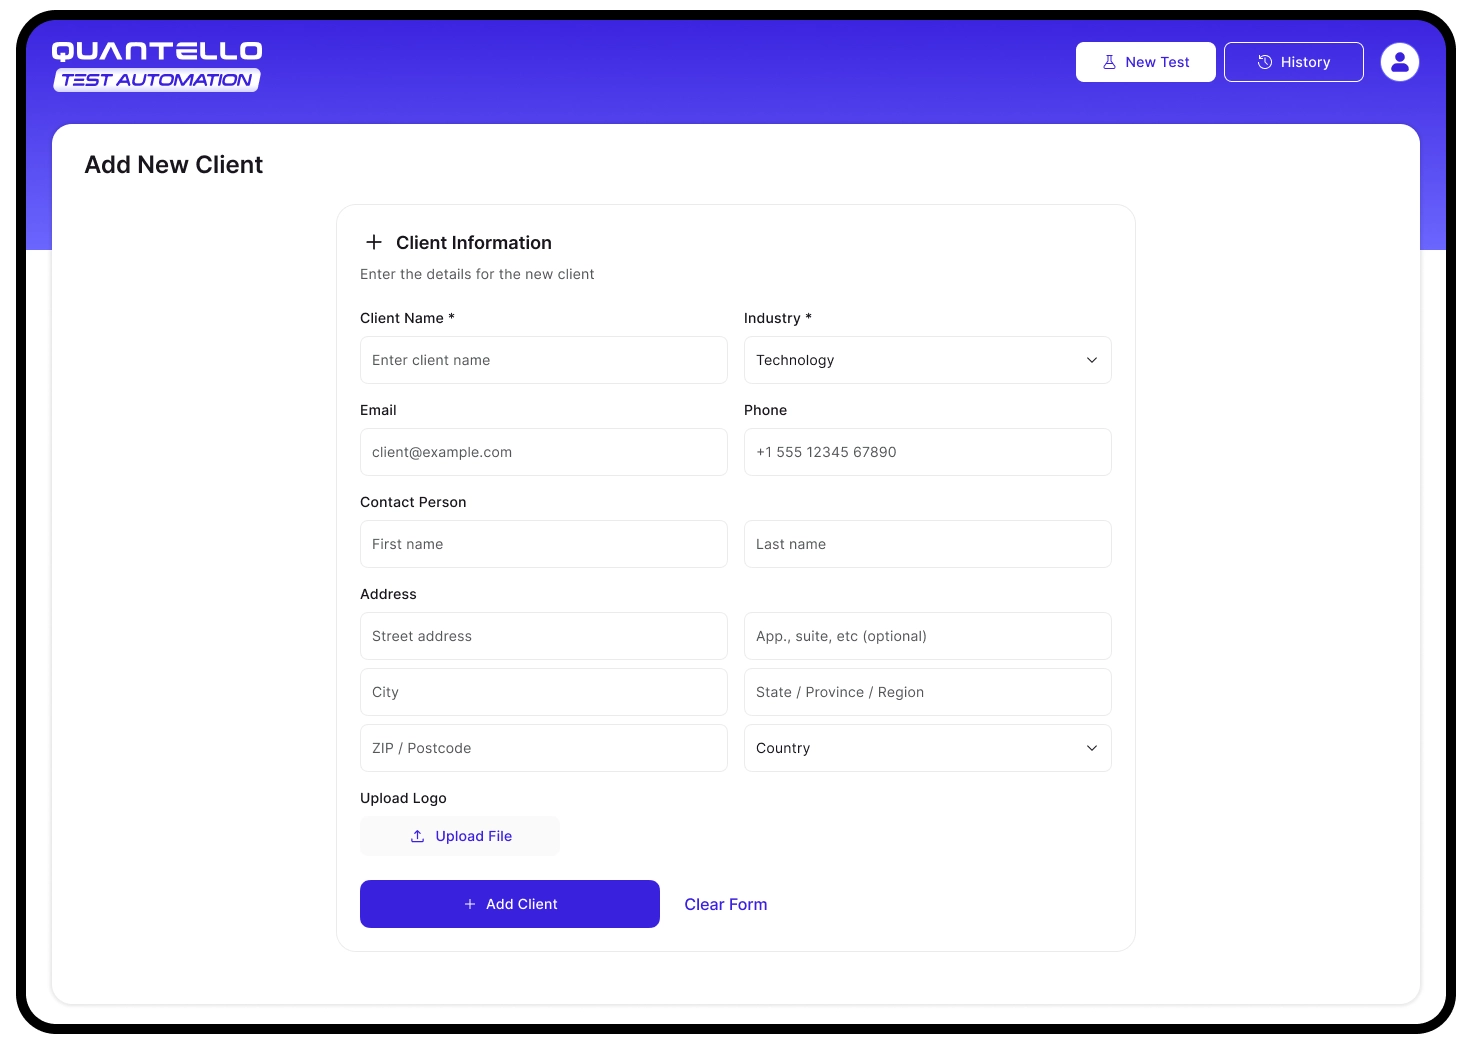
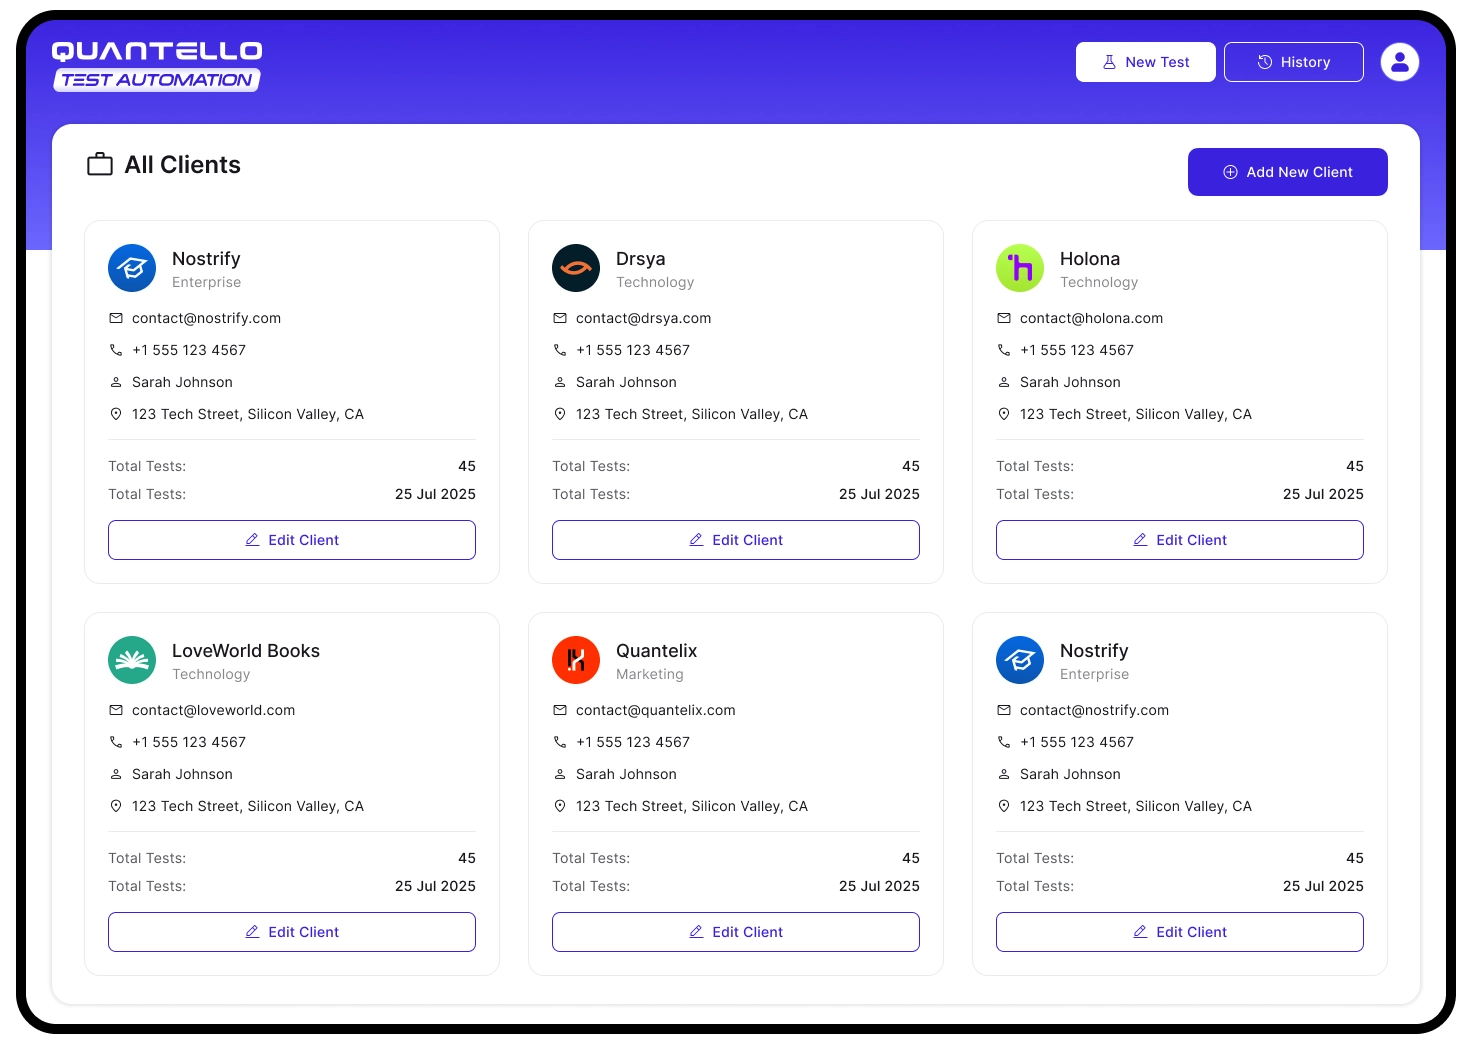
Client-centric design ensures agencies and QA teams can keep projects separate, improving traceability and accountability.
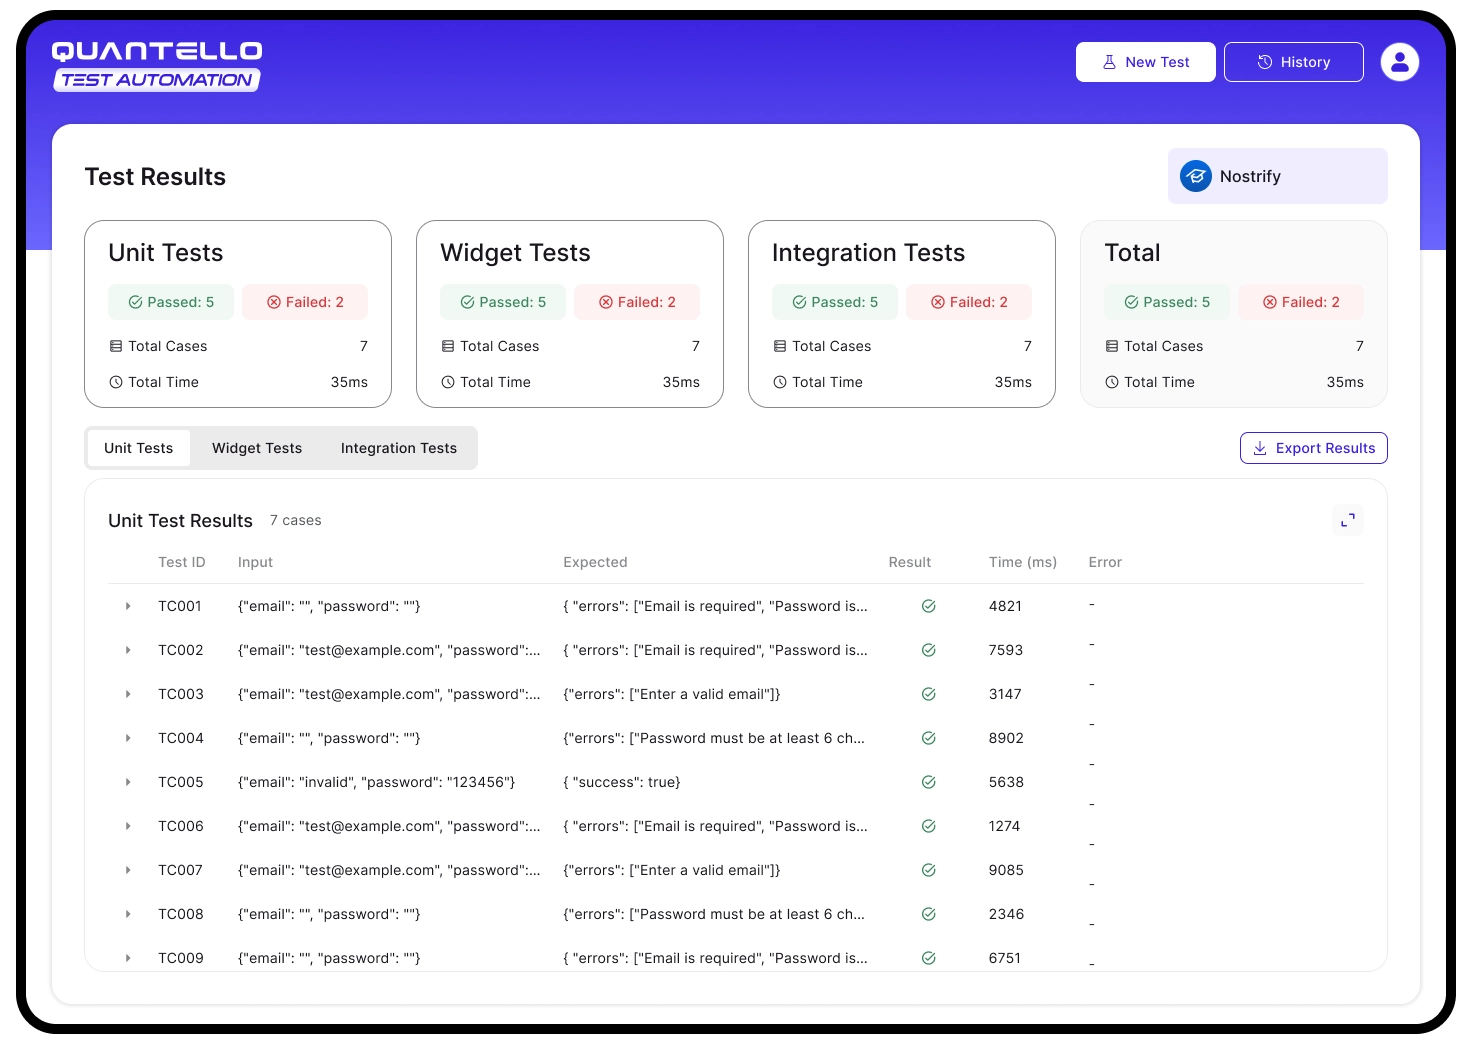
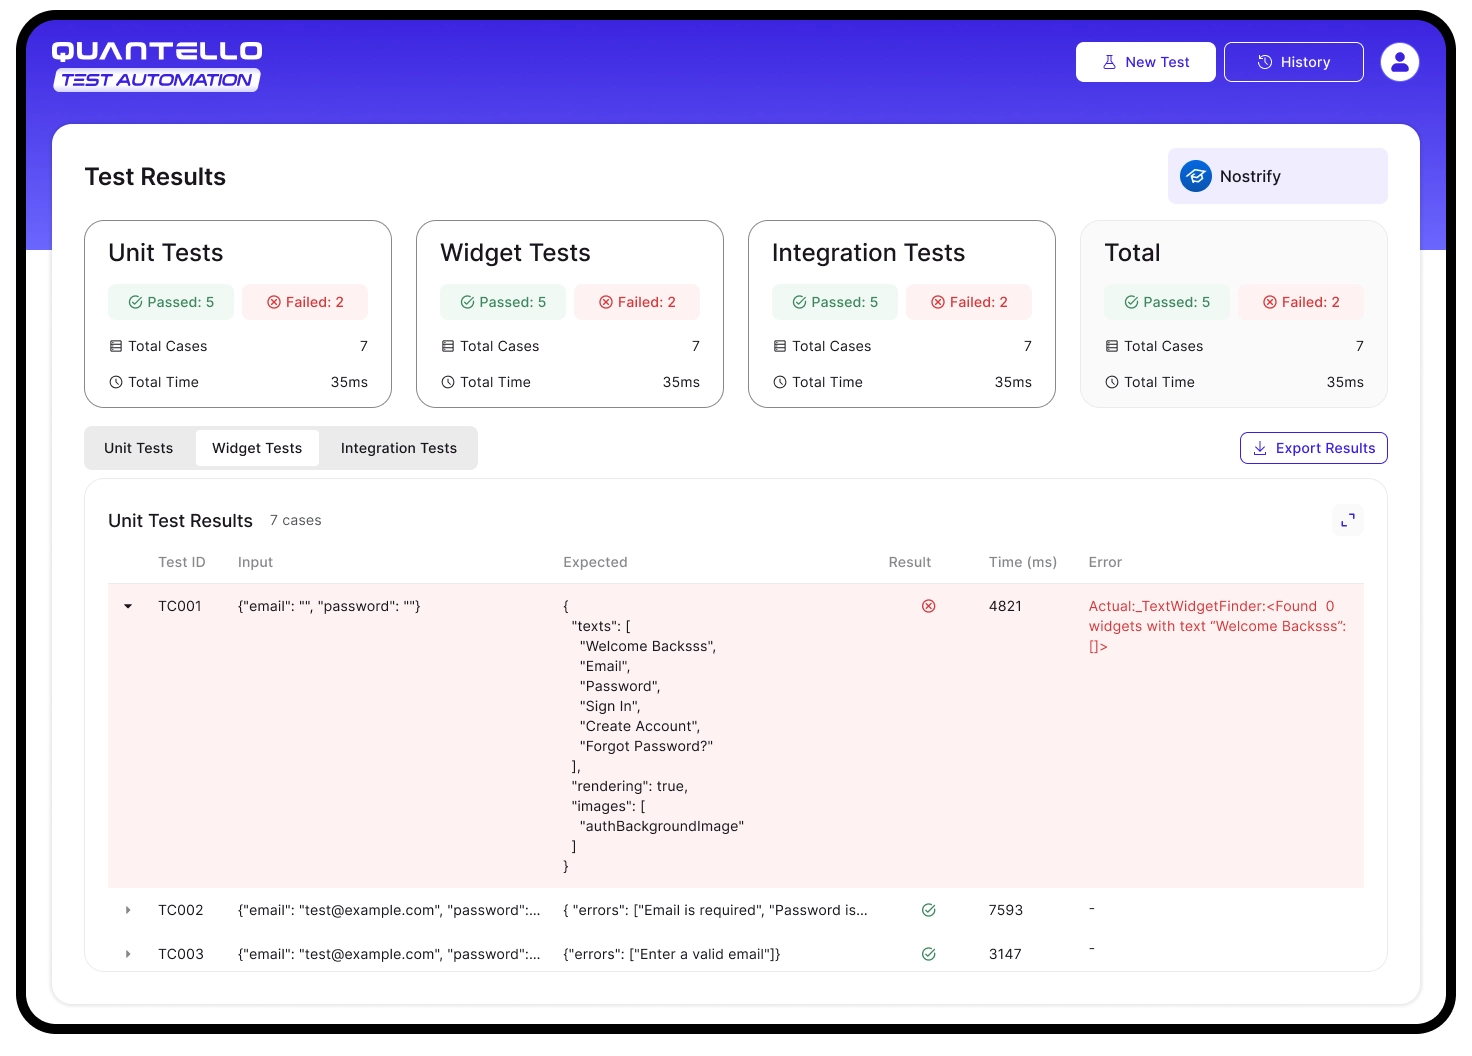
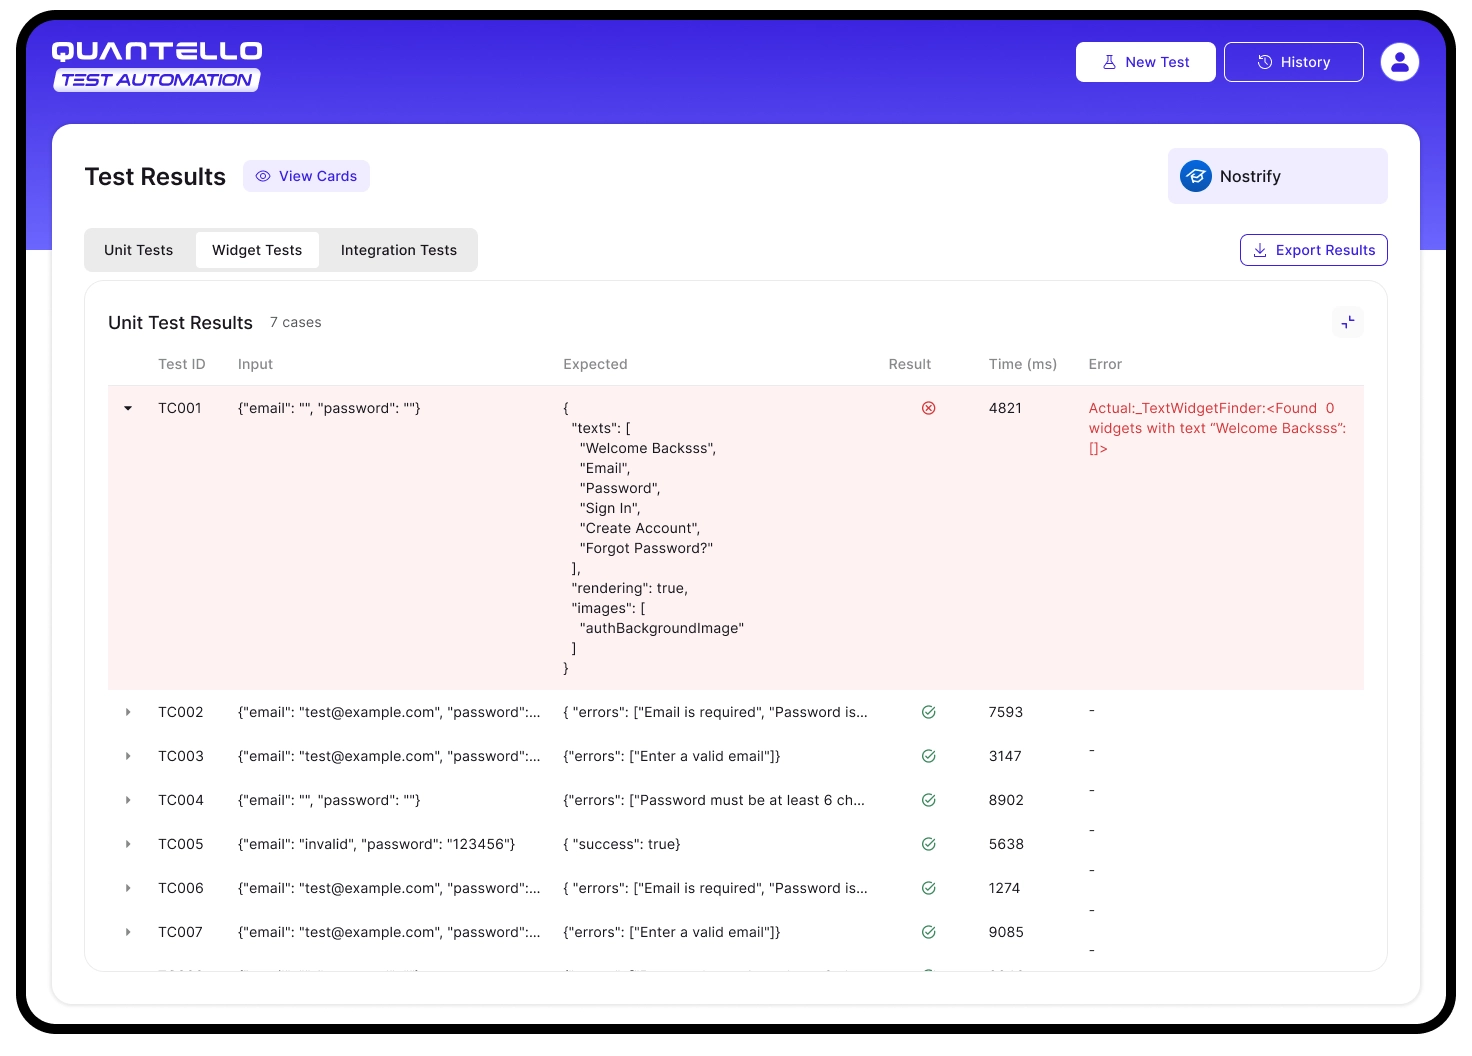
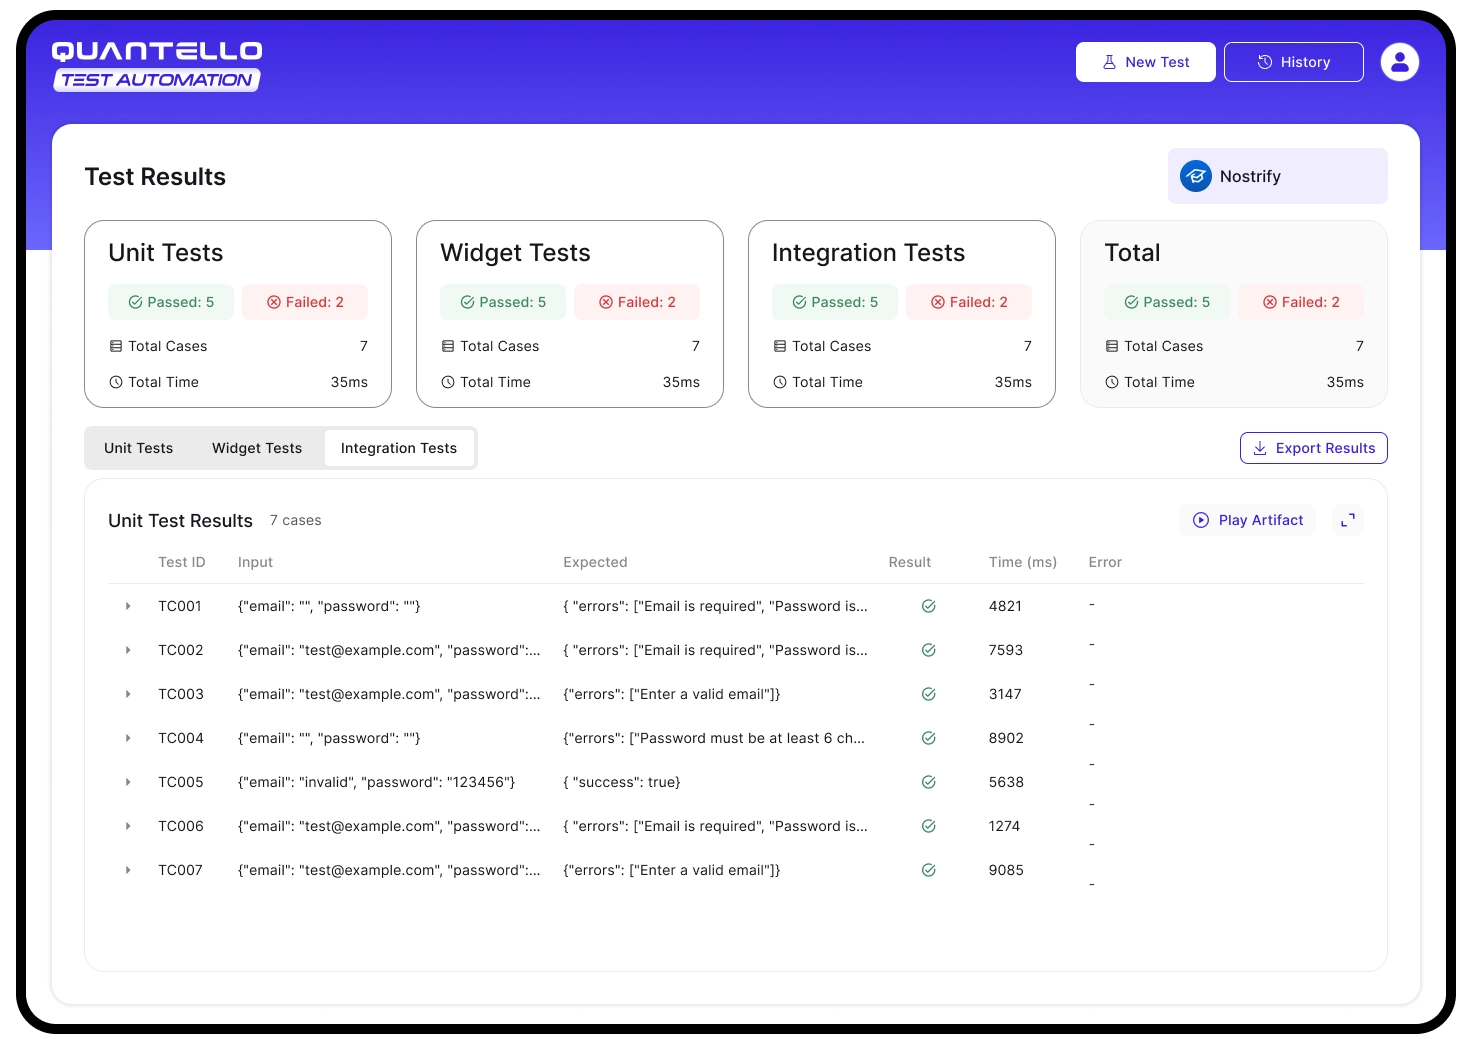
Quick-glance cards give overall status, while detailed tables provide actionable debugging insights (inputs, outputs, errors, execution times).
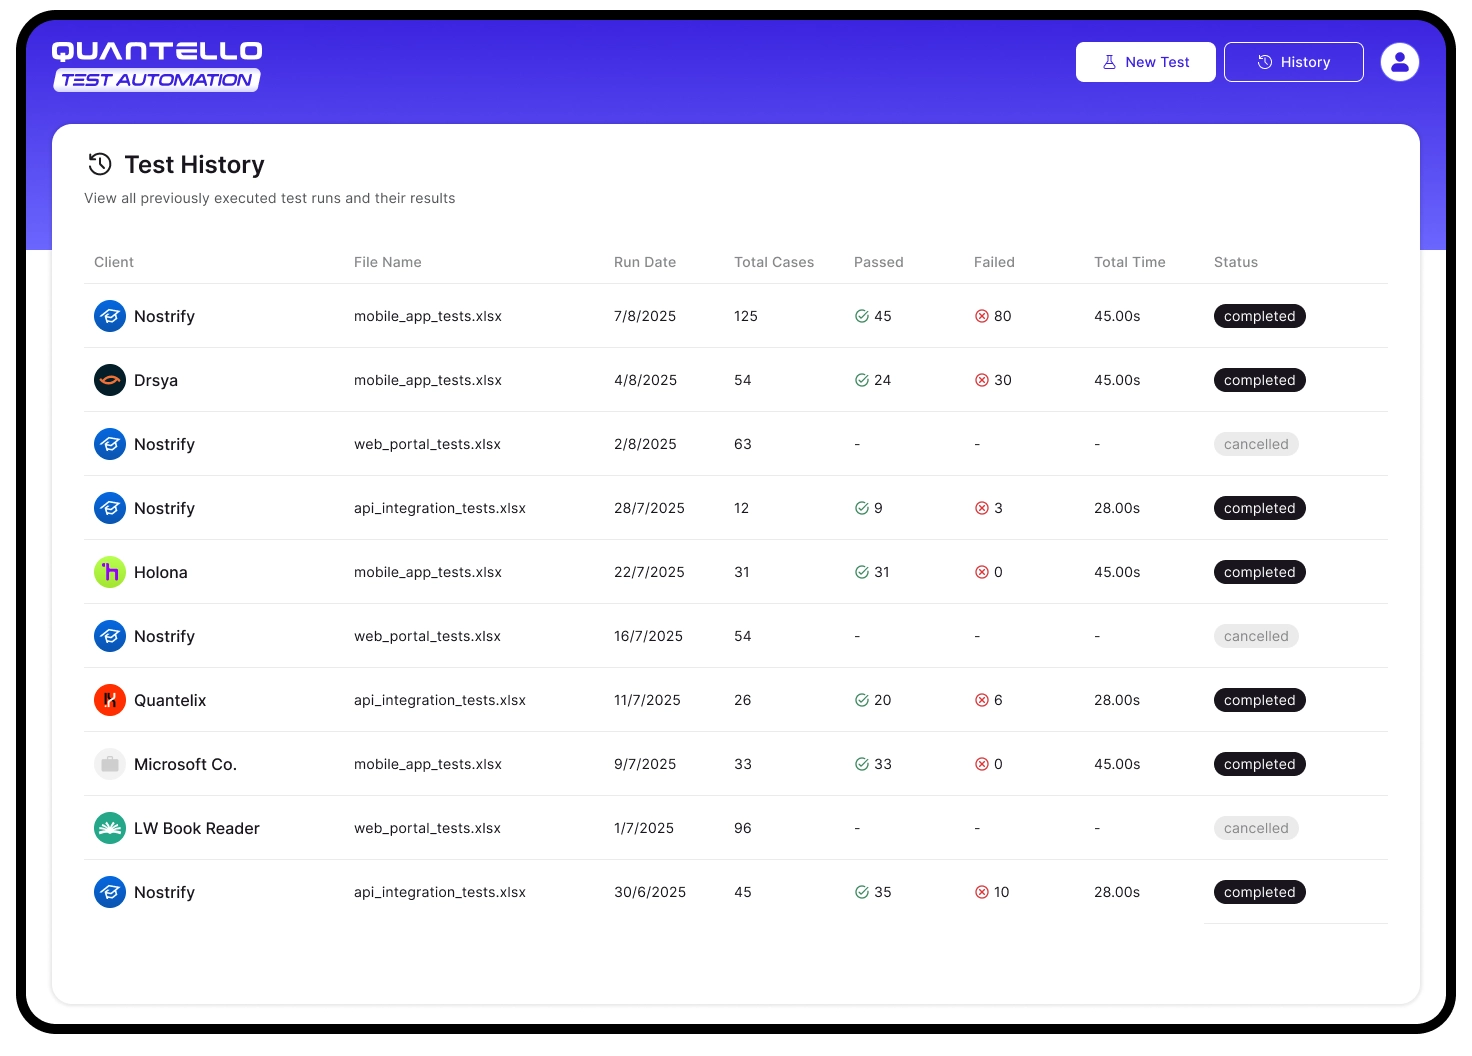
Centralized history makes QA processes transparent, enabling trend analysis and audits across clients.
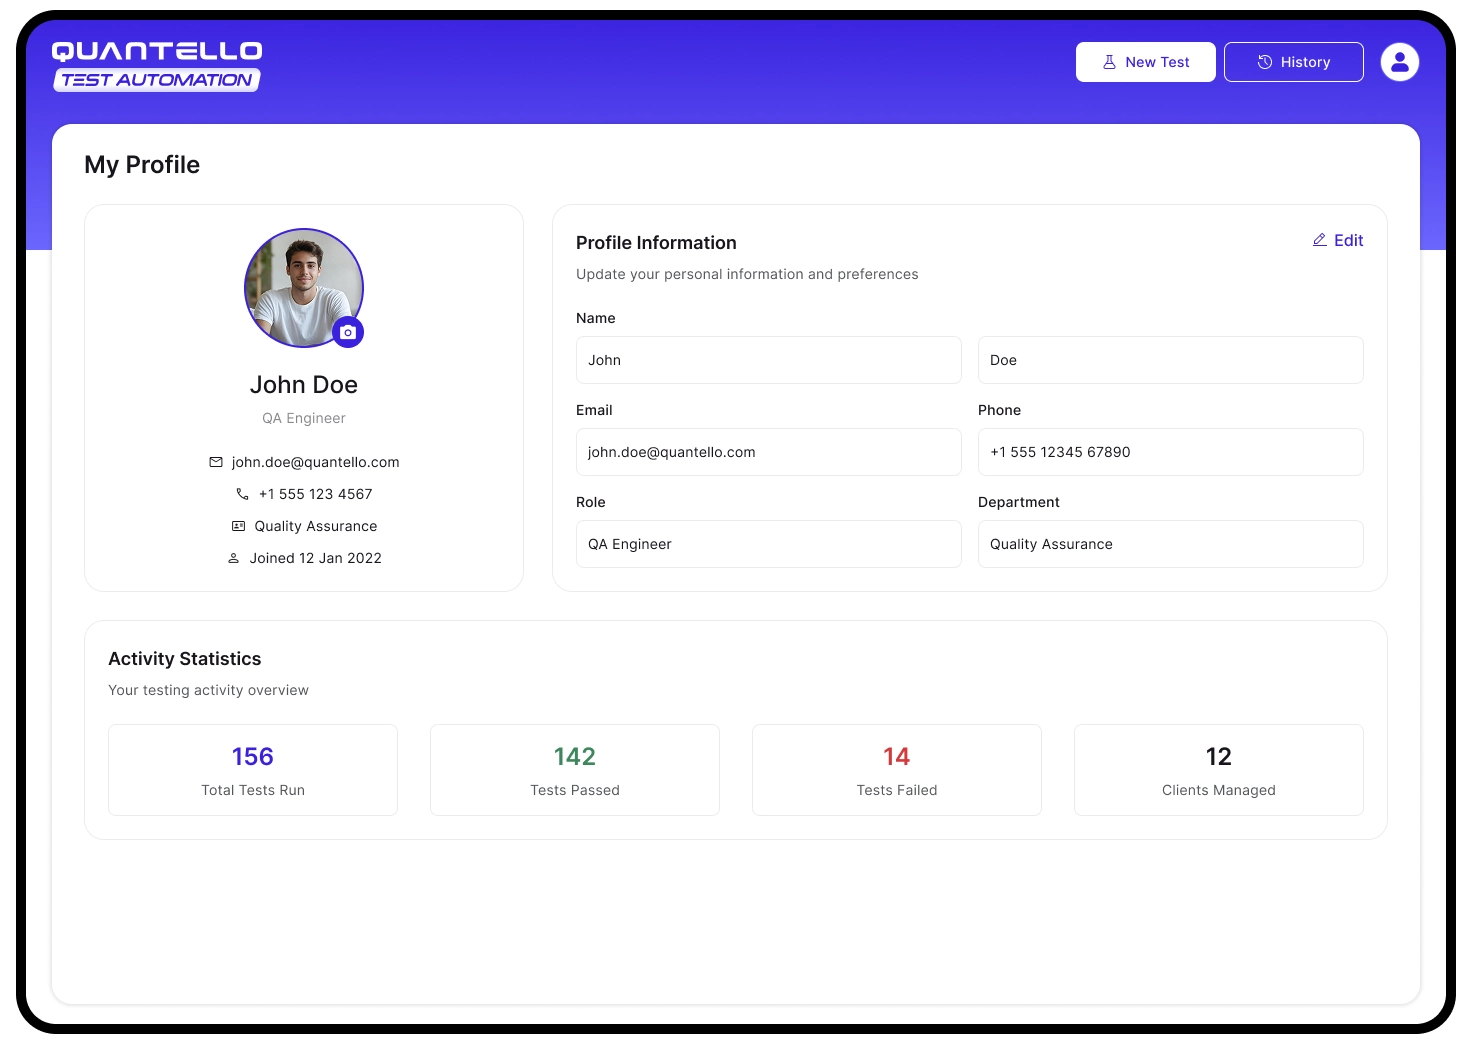
Personalized dashboards highlight individual contributions and foster accountability within QA teams.